Fig. 5.

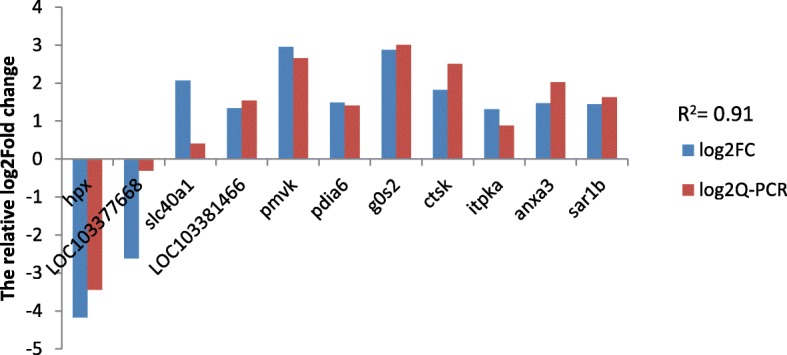
Validation by qPCR. Comparison of the relative log2(fold changes) between RNA-seq and qPCR after salinity acclimation compared to the control, as normalized to expression of the 18 s gene

Validation by qPCR. Comparison of the relative log2(fold changes) between RNA-seq and qPCR after salinity acclimation compared to the control, as normalized to expression of the 18 s gene