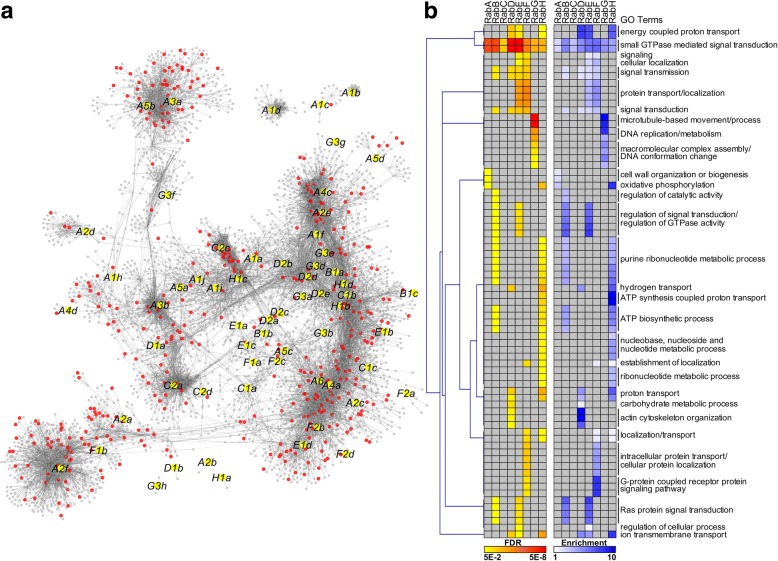
Fig. 4.
Co-expression network of PtRabs. a Co-expression network of PtRabs. Yellow and red nodes indicate PtRabs and transcription factors (TFs) in the co-expression network, respectively. b Hierarchical clustering of enriched GO terms of co-expression sub-networks of eight PtRab subfamilies (RabA-H). Colors represent FDR (yellow to red) or enrichment (white to blue); grey indicates no significant enrichment. Details of genes in PtRabs co-expression network and GO enrichment were shown in Table S4 and S5

