Fig. 1.

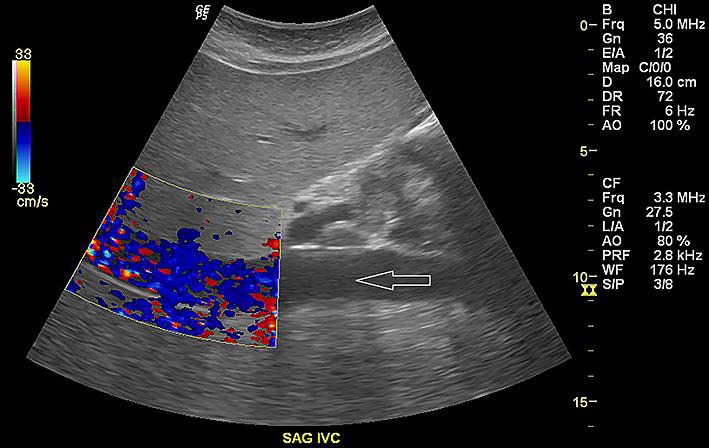
Sonogram (right upper quadrant) showing hepatomegaly with echogenic appearance of hepatic parenchyma compatible with fatty infiltration or hepatocellular disease. Trace ascites can be seen (white arrow).

Sonogram (right upper quadrant) showing hepatomegaly with echogenic appearance of hepatic parenchyma compatible with fatty infiltration or hepatocellular disease. Trace ascites can be seen (white arrow).