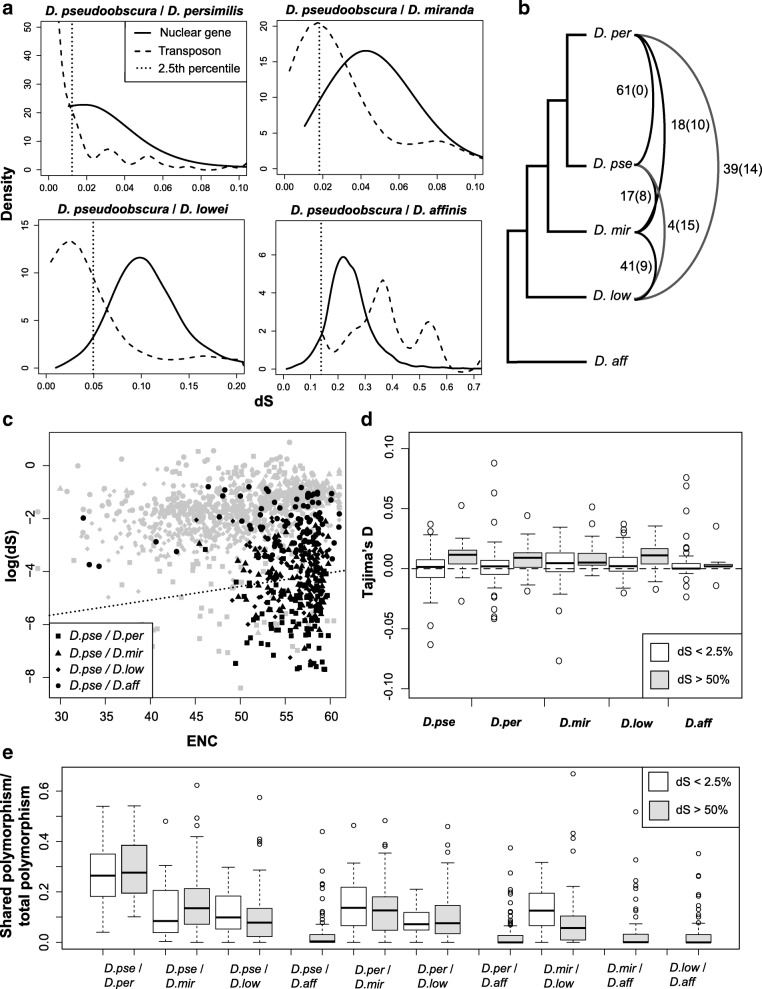
Fig. 3.
a Pairwise comparison of silent site diversity (dS) for nuclear genes (solid line) and shared TEs (dashed lines) between D. pseudoobscura, D. pseudoobscura bogotana, D. persimilis and other species. The lower 2.5% quartile for nuclear dS is shown as the dotted vertical line. These distributions are consistent between all species pair comparisons (t-test p-value > 0.13), so only comparisons to D. pseudoobscura are shown. b The number of transfer events for transposable elements based on dS and confirmed with VHICA. The number in brackets shows events that can be seen in the assembled phylogenies. Note that many events could be occurring between species vertically as well as horizontally. c effective number of codons (ENC) for genes (in grey) and TEs (black) versus dS between species pairs. Each shape represents a species pair. The dotted line represents the lower 2.5th percentile per 5 EHC window for D.pse/D.per and D.pse/D.mir (due to high similarity). These distributions are consistent between all species pair comparisons shown in Fig. 2a. (t-test p-value > 0.05), so only comparisons to D. pseudoobscura are shown. Again, only D. affinis shows no evidence of exchange between species. d Comparison of Tajimas D across species for frequently exchanged TEs and rarely exchanged TEs shows no difference, suggesting no population expansion. e Proportion of shared nucleotide polymorphism sites between TE sequences in species, out of total nucleotide polymorphism sites, divided by TE families with low dS relative to nuclear genes and TEs with higher dS

