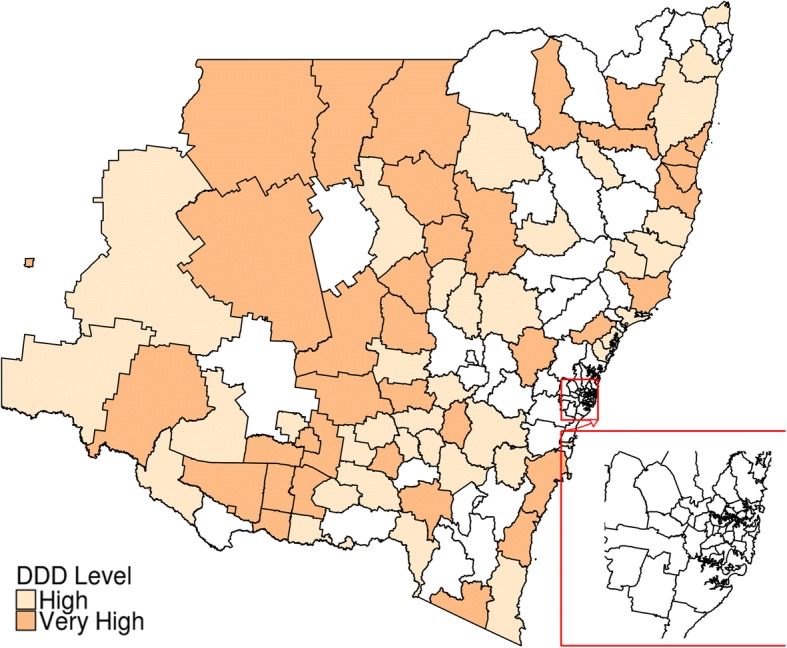
Fig. 2.

LGAs with relatively high dispensing of prescription opioid in 2015. (This map has been developed using bioregional assessment source dataset, available under a Creative Commons Attribution license. Australian Bureau of Statistics (2011) Local Government Areas of Australia. Bioregional Assessment Source Dataset)
