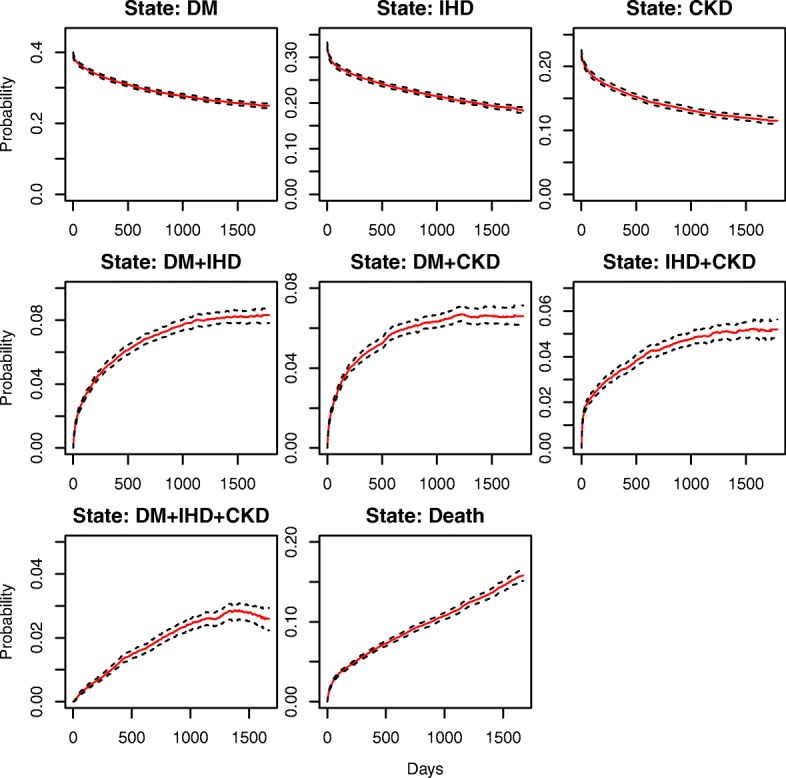
Fig. 2.

Estimated marginal state occupational probabilities for the multistate model along with 95% bootstrap based confidence bands. We illustrate state occupation probabilities with a solid line and corresponding 95% confidence bands with dotted lines. Note: different spans of y axis were used for different sets of states
