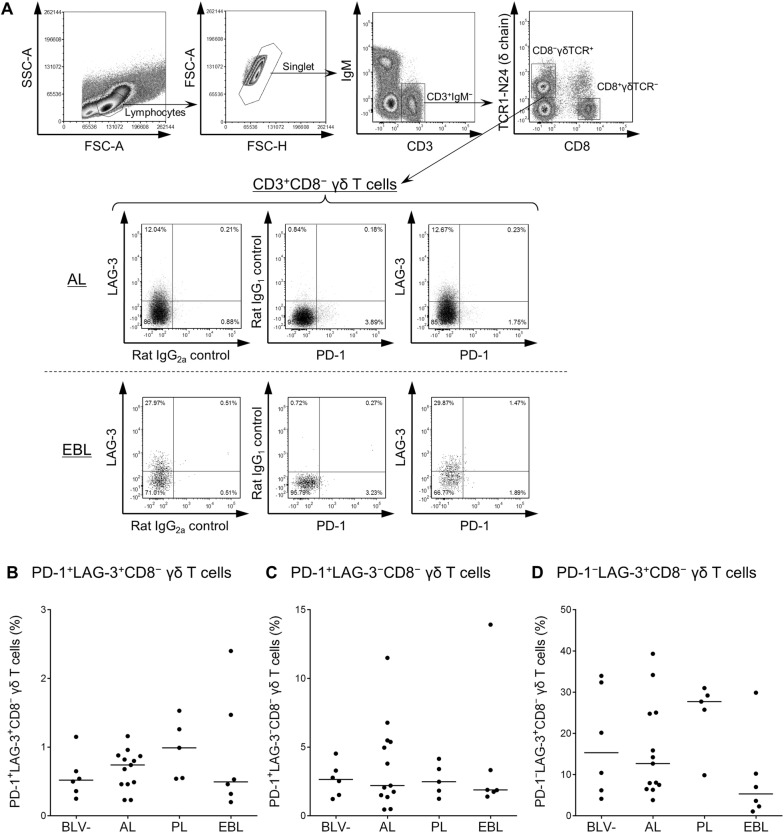
Figure 3.
Expression of PD-1 and LAG-3 on γδ T cells in BLV-infected cattle. A Gating strategy and representative dot plots for expression analyses of PD-1 and LAG-3 on IgM−CD3+CD8−γδTCR+ T cells from peripheral blood of BLV-infected cattle (AL and EBL). Values in the quadrants indicate percentages of cells. Percentages of PD-1+LAG-3+CD8− γδ T cells (B), PD-1+LAG-3−CD8− γδ T cells (C), and PD-1−LAG-3+CD8− γδ T cells (D) in CD3+CD8− γδ T-cell population in peripheral blood from BLV − (n = 6), AL (n = 13), PL (n = 5), and EBL cattle (n = 6). Bars indicate group median percentage. Significant differences between each group were determined using a Kruskal–Wallis test.

