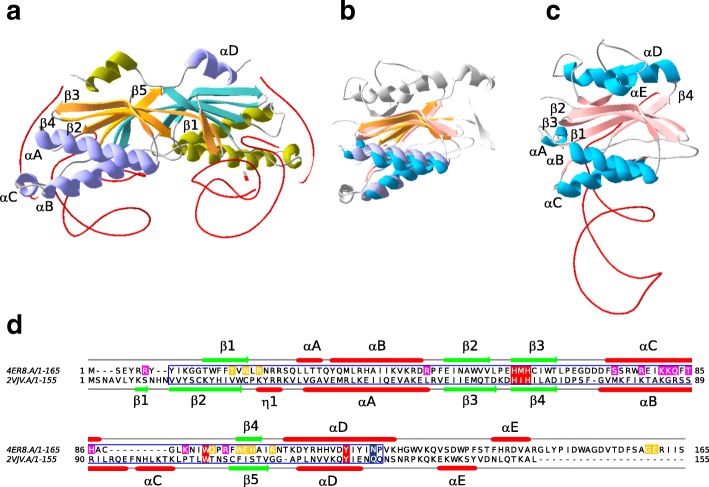
Fig. 1.
Structural homology between TnpAIS200 and TnpAREP. Panel a TnpAIS200 from H. pylori TnpAIS608 dimer (PDB 2VJV) as a ribbon diagram with one molecule colored cyan (β sheets) and purple (α helix) the other molecule in orange (β sheets) and green (α helix), with the DNA in red. Panel c E. coli TnpAREP monomer (PDB 4ER8). Panel b TnpAIS608 and TnpAREP monomer structure superposition, with un-conserved structural elements in grey. The superpositioning was accomplished using SWISS-MODEL and the visualization with Swiss-PdbViewer [86] (https://spdbv.vital-it.ch/). Panel d TnpAREP (4ER8) and TnpAIS608 (2VJV) sequence alignment with the secondary structures. HuH, W and Y conserved residues in red boxes, the residues essential for transposition in vivo (Q131 in H. pylori and N119 in TnpAREP from E. coli MG1655) in blue, residues involved in 5′ GTAG interaction in yellow and residues REP sequence hairpin interaction in magenta, the core conserved domain in blue frame

