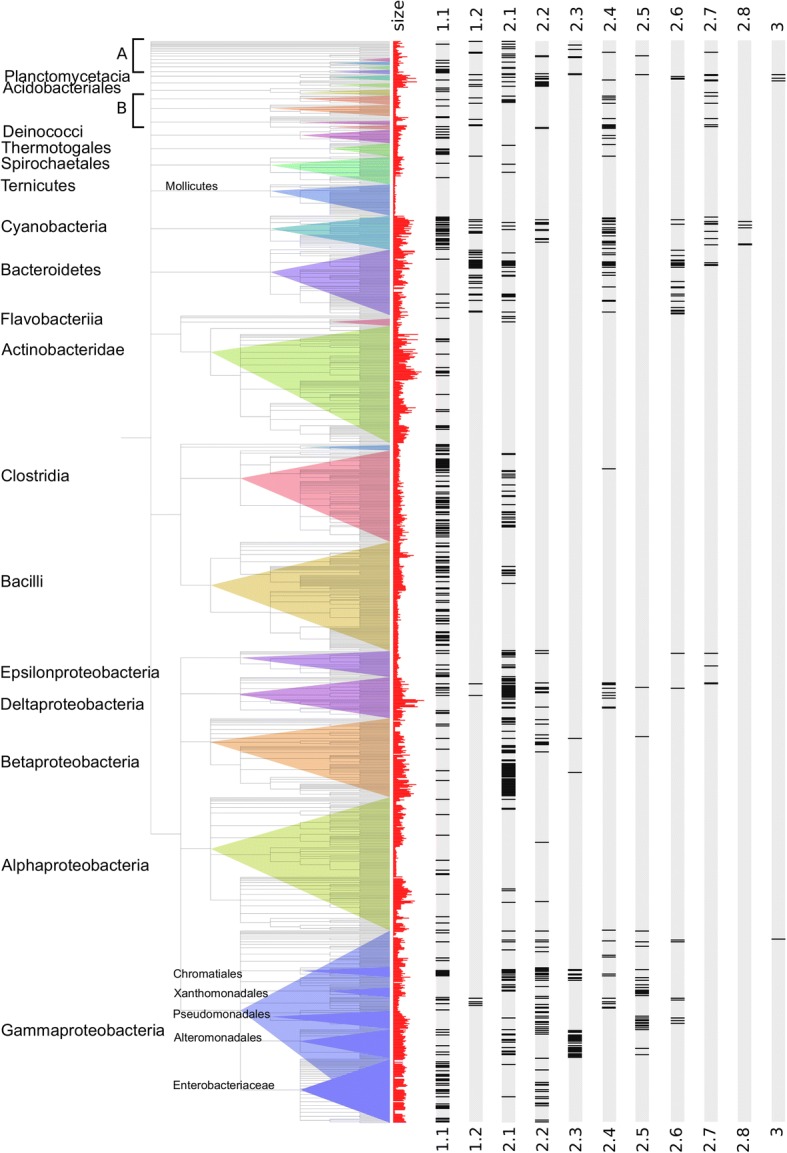
Fig. 4.

Taxonomic distribution of the TnpAY1 subclasses. Each species of our sample of complete bacterial genomes is represented by one strain and displayed according to the NCBI taxonomic tree (phyla levels). Names of the largest phyla are indicated, first column, histogram of the genome sizes (red), next columns gene occurrence for each subclass. Black bands indicate the presence of at least one copy of the subclass in the genome. a includes Deferribacterales, Nitrospirales, Synergistia and Fusobacteriales. b includes Aquificales, Chlorobia, Chlamydiales and Chloroflexi
