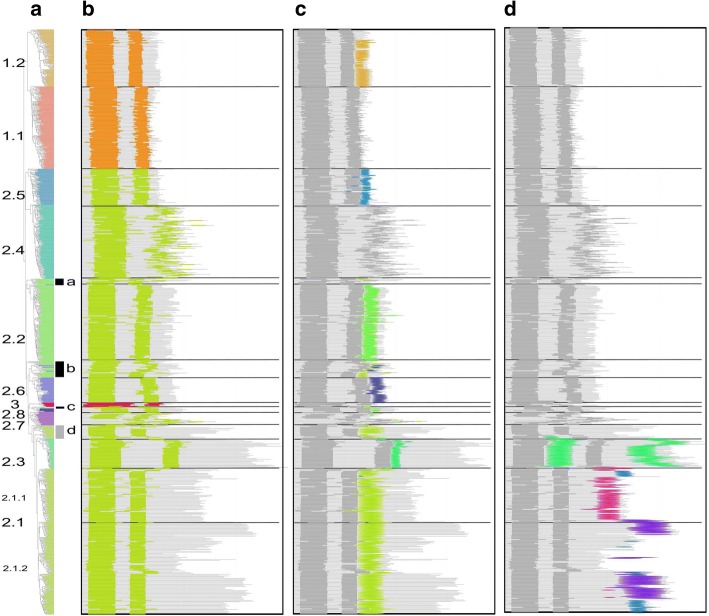
Fig. 6.
Global domain organization. Proteins are shown as horizontal grey lines with colored patterns that refer to distinct features. Each panel highlights sequential protein domains. a Phylogenetic tree with subclass annotations. The black and grey segments highlight subsets of sequences misclassified by MCL (Fig. 3). b Positions of the upstream and downstream sub-domains of the core domain are shown in orange for TnpAIS200/IS605, green for TnpAREP and red for class 3. c Short conserved domains found next to the core domain. d Additional conserved domains found in C-term regions and between two half of the core domain

