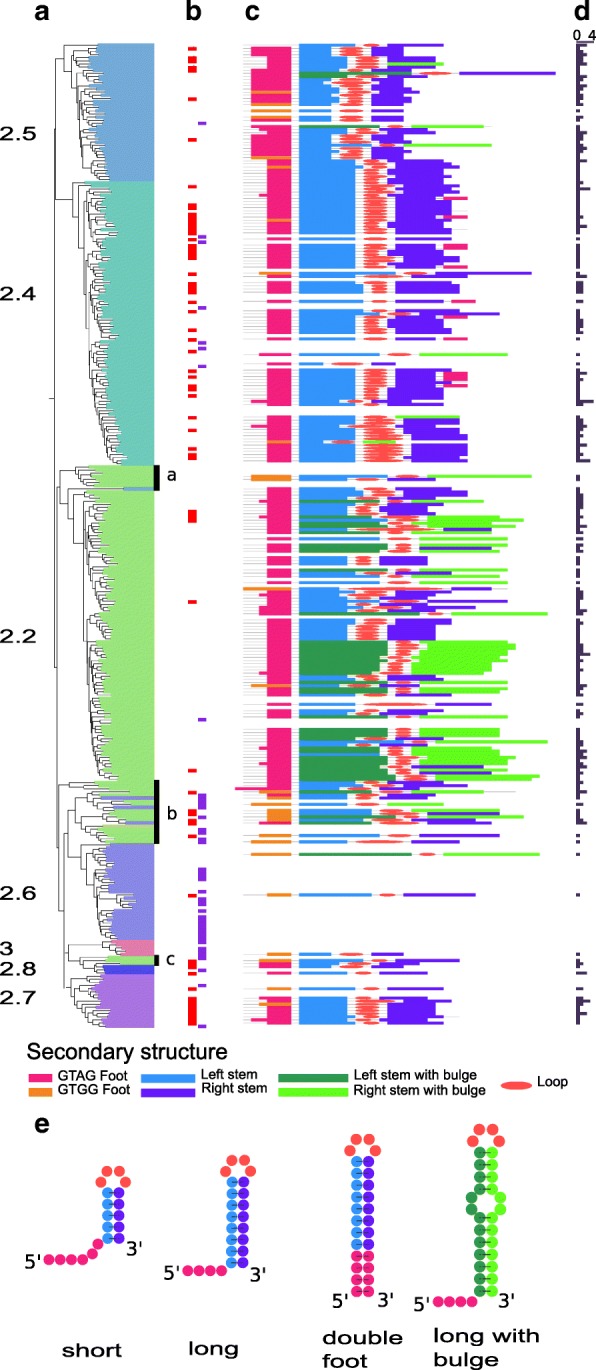
Fig. 7.

REP secondary structures and distribution. a Phylogenetic tree with subclass annotations. b REP sequences annotated by manual inspection: red rectangles, REP sequences also found by automatic annotation and violet rectangles, REP sequences missed by automatic annotation. c Schematic representation of REP sequences found by automatic annotation, only the more frequent REP sequence family is reported for each REPtron. d Histogram of the number of REP sequences families per REPtron. e Distinguishable REP sequence secondary structure types
