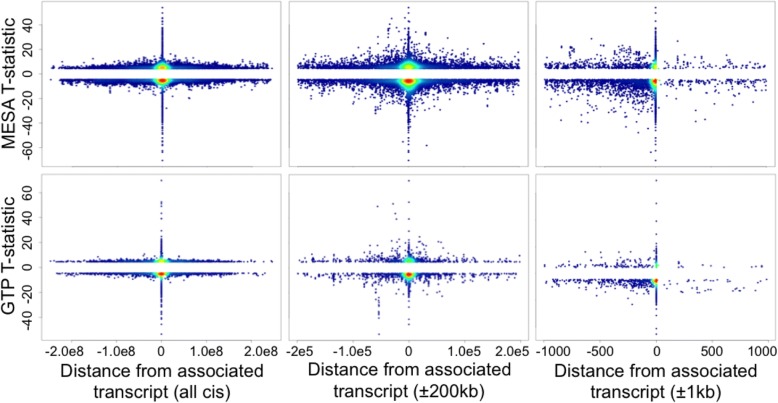
Fig. 1.
Scatter plot of T-statistic vs. distance from associated transcript, among suggestively significant eCpGs (P < 1e-5). The top row is from MESA and the bottom from GTP. The leftmost column is for all cis and distal eCpGs. The middle and right columns contain only eCpGs within 200 kb and 1 kb from their cognate transcript, respectively

