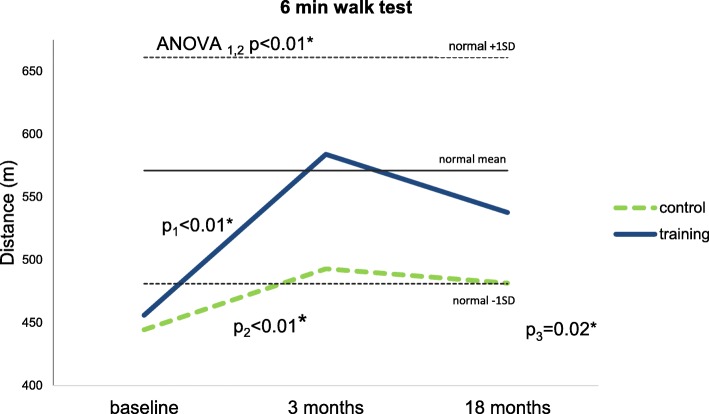
Fig. 2.
Six-minute walking test (6MWT) (group mean). p1—difference between the baseline’s and 3 months’ mean for the training group. p2—difference between the 3 months’ and 18 months’ mean for the control group. p3—difference between the baseline’s and 18 months’ mean for the training group. ANOVA1,2—one-way repeated-measures ANOVA between the baseline’s and 3 months’ mean. Horizontal solid and dashed lines indicate the mean expected walking distance (571 m), with 95% CI (± 90 m) in a normal, age-matched population, respectively [21]

