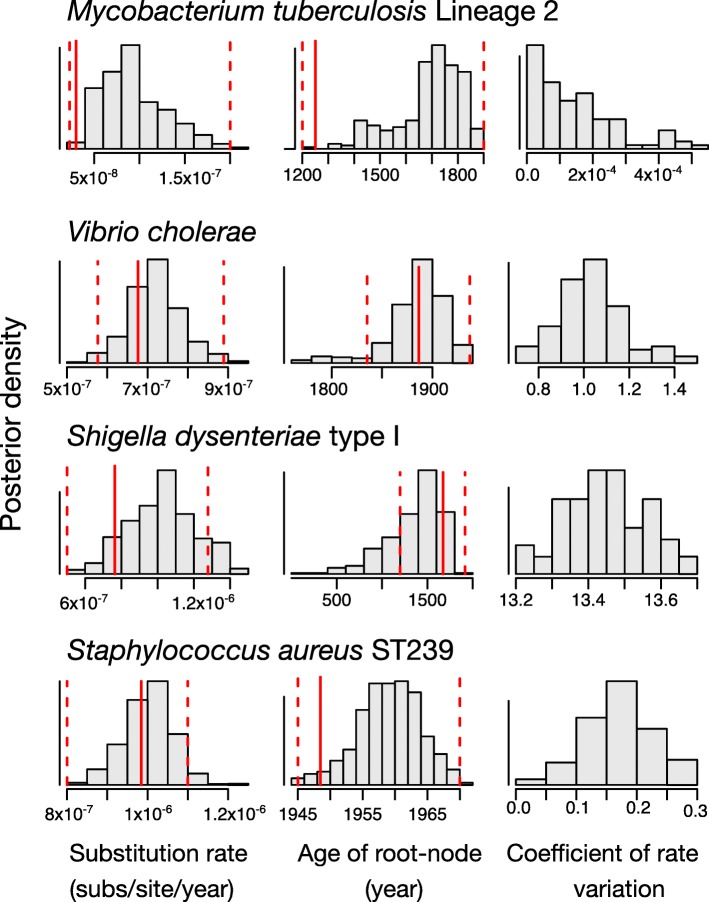
Fig. 1.
Estimates of evolutionary rate, time to the most recent common ancestor, and the coefficient of rate variation of the UCLN. The histograms correspond to the posterior distribution in BEAST2 using the full Bayesian approach. With the exception of the Mycobacterium tuberculosis data set, we used the UCLN clock model because the coefficient of rate variation was not abutting zero. The red solid line is the estimate from LSD, and the dashed lines correspond to the 95% confidence interval. Note that the coefficient of rate variation is not computed for LSD, which assumes a strict molecular clock

