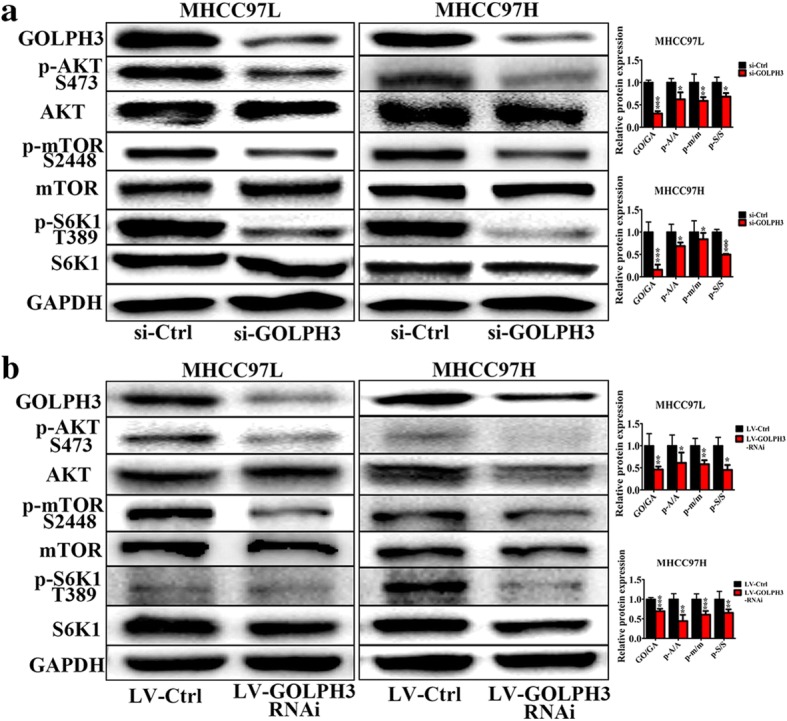
Fig. 5.

Knockdown of GOLPH3 inactivated mTOR signaling pathway in HCC in vitro and in vivo; a Western blotting of AKT, p-AKT (Ser473), mTOR, p-mTOR (Ser2448), S6 K1 and p-S6 K1 (Thr389) in MHCC97L and MHCC97H cells transfected with si-Ctrl and si-GOLPH3. b Western blotting of AKT, p-AKT (Ser473), mTOR, p-mTOR (Ser2448), S6 K1 and p-S6 K1 (Thr389) in Xenograft tumor model injected with LV-Ctrl or LV-GOLPH3-RNAi HCC cells. The expression levels were normalized to GAPDH. In Column diagram, GO, GA, A, p-A, m and p-m means GOLPH3, GAPDH, AKT, p-AKT, mTOR and p-mTOR respectively. All experiments were performed in triplicate with at least three independent experiments. Data were presented as the mean ± SD. P-values were calculated using Student’s t-test, * P < 0.05, ** P < 0.01, *** P < 0.001
