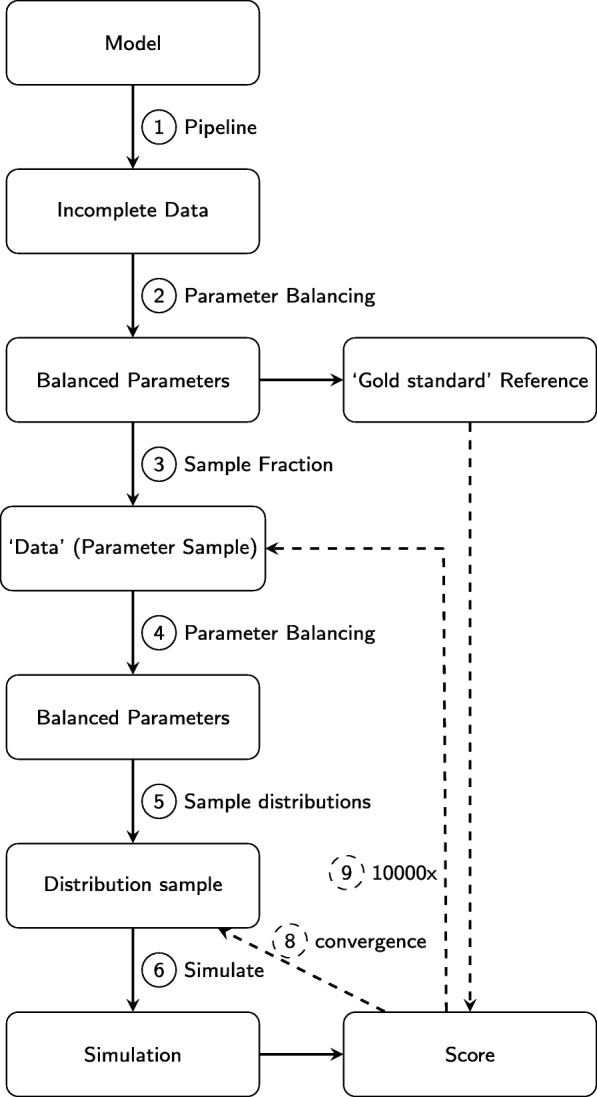
Fig. 4.

Analysing the robustness of DMPy. Schematic explanation of tests performed to assess the robustness of our pipeline. Using prior information for kinetic rates in the system (1), a model is created whereby the distribution of all parameters is known (2). The median of all parameter distributions is then used to simulate a ‘gold standard’ set of time-series of system components. We then use a subset of the known parameter distributions (3) as an input to create a new model of metabolism (4), whose parameter distributions are sampled (5) and the resulting dynamic model is simulated (6) and compared to the ‘gold standard’ reference. When the score converges (8), it is saved and a new fraction of the ‘Data’ parameters is drawn (9)
