
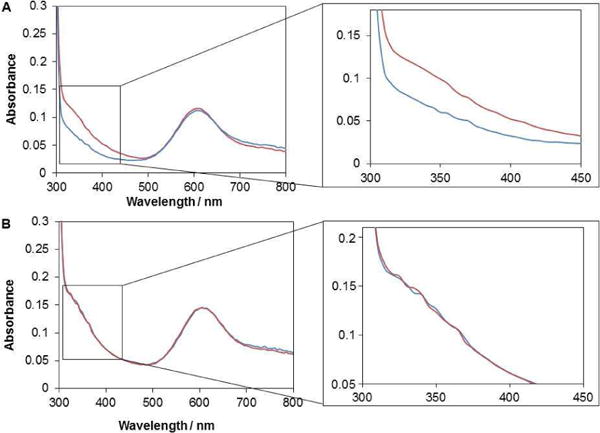
Figure 2.
UV-visible spectra of B. pumilus BOD at 25°C and at (A) pH 4, and (B) pH 7; As isolated enzyme before (red curve), and after 200 mM NaCl addition (blue curve). The graph on the right is a zoom on the 330 nm shoulder.
Official websites use .gov
A
.gov website belongs to an official
government organization in the United States.
Secure .gov websites use HTTPS
A lock (
) or https:// means you've safely
connected to the .gov website. Share sensitive
information only on official, secure websites.
UV-visible spectra of B. pumilus BOD at 25°C and at (A) pH 4, and (B) pH 7; As isolated enzyme before (red curve), and after 200 mM NaCl addition (blue curve). The graph on the right is a zoom on the 330 nm shoulder.