
Figure 3.
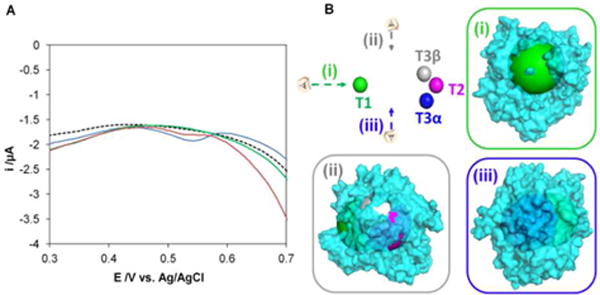
Electrical connection of the Cu centers in B. Pumilus BOD. (A) Square Wave Voltametry (SWV) of the immobilized B. pumilus BOD at pH 4 and 37°C in 200-100 mM phosphate-citrate buffer under anaerobic conditions. RO form of the enzyme (blue line), AR form of the enzyme after NaCl addition (green line), and reactivated enzyme obtained as described in Fig. SI4 (red line). The attribution of the peak to the T1 Cu is confirmed by the corresponding potential and a comparison with the signal of the bare electrode (black dashed line). SWV parameters: 5 mV.s−1, amplitude 25 mV, frequency 1 Hz. Electrode modified as in Fig 1. (B). Illustration of electron accessibility from protein surface to copper centers in the BOD from B. Pumilus. Top left: Copper centers only from the 3D model of BOD are represented by spheres, and colored, T1 (green) T3β (grey) T3α (blue) and T2 (Pink). Views (i), (ii) and (iii): Three representations of semi-transparent molecular surface of the BOD colored in cyan and showing spheres with 15 Å of radius centered on each copper atom. Spheres are colored with respect to the corresponding copper site. The distance from the surface of the protein to each copper center is less than 15 Å except for the T3α. Protein representations were generated using the program PyMOL (The PyMOL Molecular Graphics System, Schrödinger, LLC).