
Figure 4.
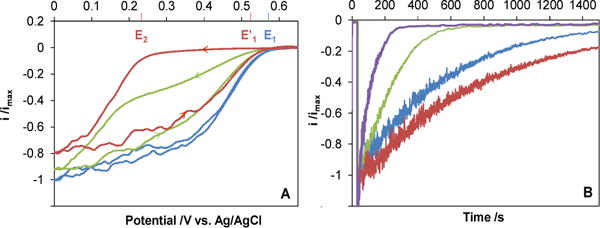
O2 reduction by B. pumilus BOD at pH 4 and 37°C. (A) CV curves at 5 mV.s−1 in 200-100 mM phosphate-citrate buffer. 15 min incubation in increasing NaCl concentrations: 0 mM (blue curve), 5 mM (green curve) and 20 mM (red curve, note that higher NaCl concentrations result in the same CV shape) (B) Chronoamperometric measurement at E = + 0.3 V vs Ag/AgCl with increasing NaCl concentrations: 10 mM (red curve), 20 mM (blue curve), 50 mM (green curve) and 200 mM (purple curve). Electrodes modified as in Fig 1.