
Figure 5.
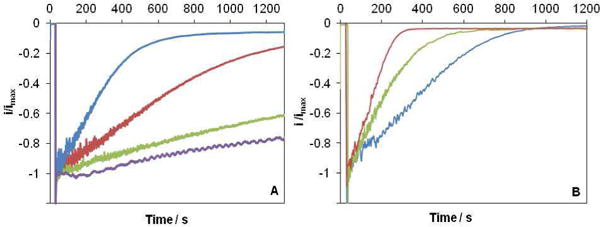
Kinetics of O2 reduction inhibition by NaCl. Chronoamperometric measurement at E = +0.3 V vs. Ag/AgCl (A) as a function of pH at T = 37°C and 50 mM NaCl: pH 4 (blue curve), pH 5 (red curve), pH 6 (green curve) and pH 7 (purple curve); (B) as a function of temperature at pH 4 and 50 mM NaCl: T = 25°C (blue curve), T = 37°C (green curve), T = 50°C (red curve). O2-saturated 200-100 mM phosphate-citrate buffer. Electrodes modified as in Fig 1.