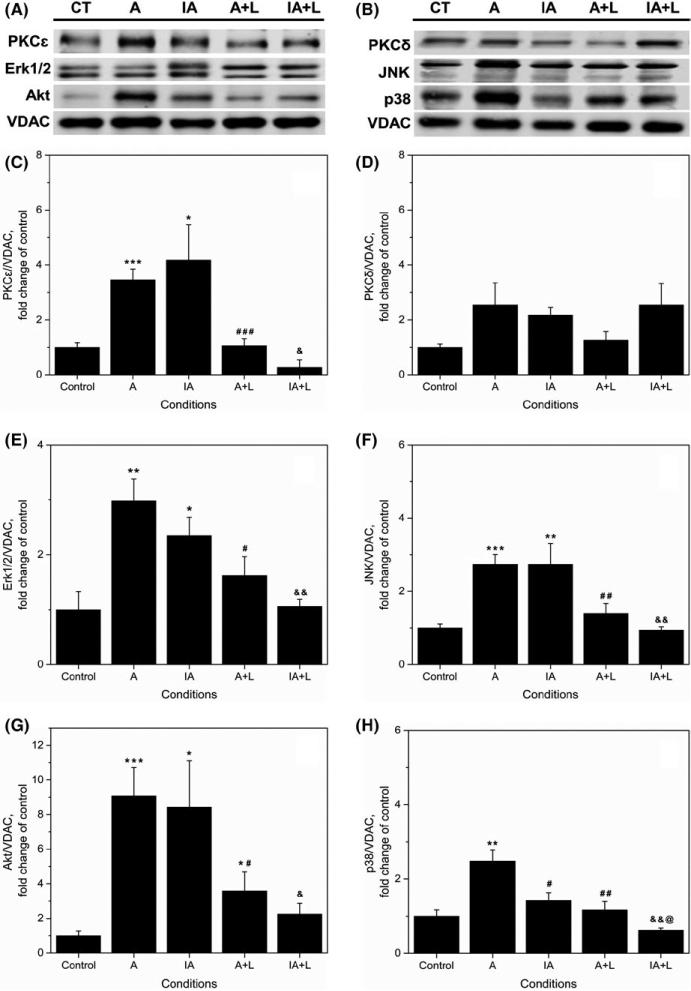
FIGURE 7.
Effects of losartan on protein levels of PKCε, PKCδ, Erk1/2, JNK, Akt, and p38 MAPK in isolated mitochondria. (A, B) Representative Western blots and quantitative data of total (C) PKCε; (D) PKCδ; (E) Erk1/2; (F) JNK; (G) Akt; (H) p38. Proteins were calculated as the ratio of total protein to VDAC, and normalized to control for each kinase. The values are shown as means ± SEM of five experiments per group. *P <.05, **P <.01, ***P <.001 vs Control; #P <.05, ##P <.01, ###P <.001, vs A; &P <.05, &&P <.01 vs IA; @P <.05 vs A+L. CT, control; I, IPC; A, APC; IA, IPC/APC; A+L, APC+losartan; IA+L, IPC/APC+losartan

