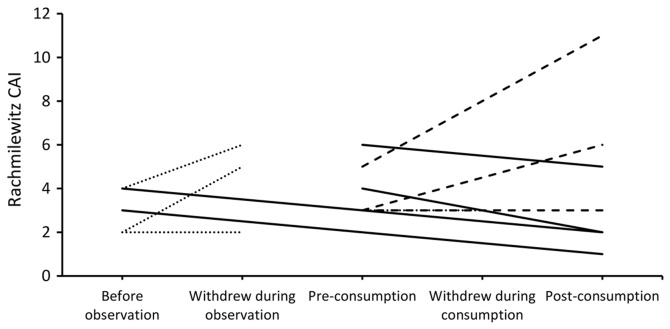
Figure 2.
Disease activity of all patients in the trial. The solid lines indicate patients in which Rachmilewitz CAI declined following consumption (responders); the broken lines indicate patients in which Rachmilewitz CAI remained unchanged or increased (non-responders); the dotted lines indicate dropout cases. CAI, clinical activity index.

