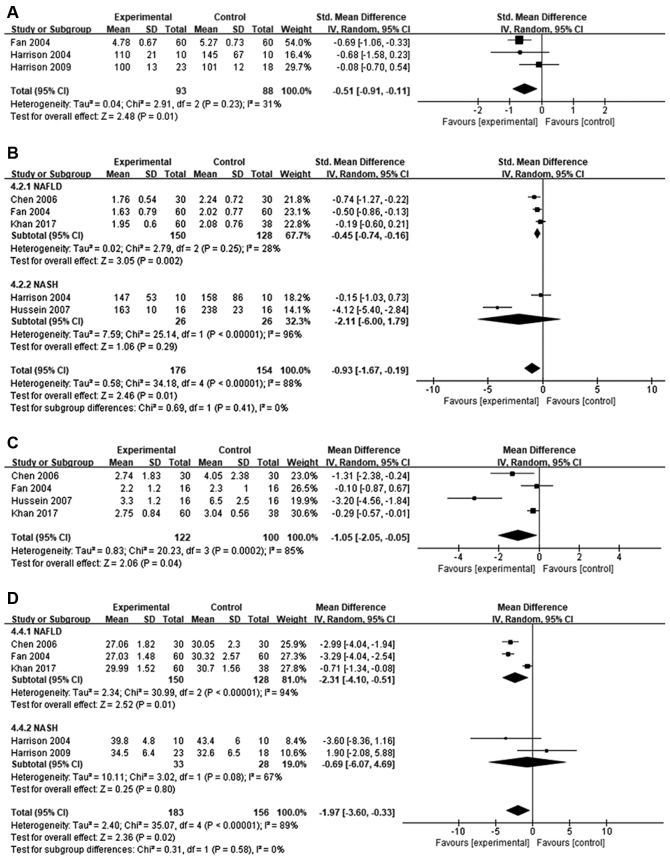
Figure 4.
Forest plots illustrating improvement in biochemical and anthropometric variables. (A) Fasting glucose; (B) triglycerides; (C) homeostasis model assessment of insulin resistance; and (D) body mass index. NAFLD, non-alcoholic fatty liver; NASH, non-alcoholic steatohepatitis; SD, standard deviation; 95% CI, 95% confidence interval; IV, independent variable.

