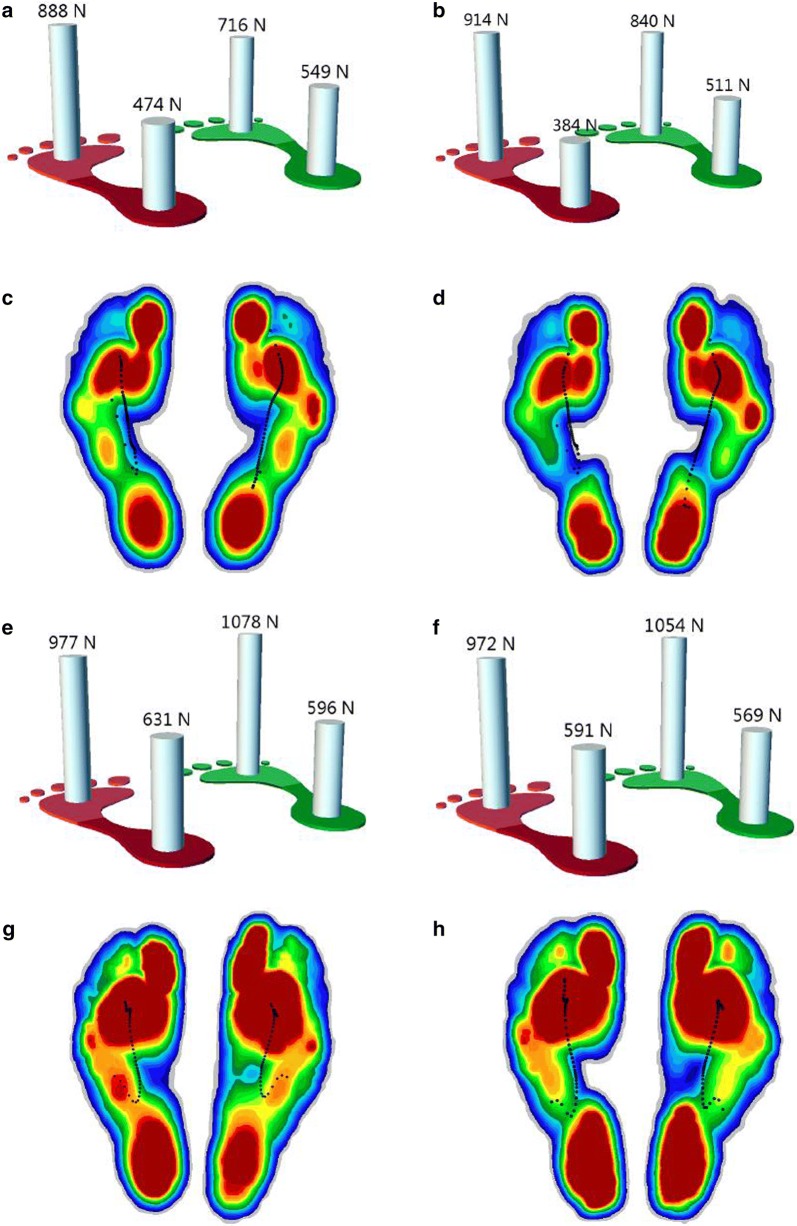
Fig. 2.
Plantar pressure analysis during walking (a–d) and jogging (e–h). a, e Overall load of forefoot and hind foot with bare foot. b, f Overall load of forefoot and hind with heel cup. The load increased on forefoot and decreased on hind foot. c, g Stress nephogram of plantar tissue with bare foot. d, h Stress nephogram of plantar tissue with heel cup. The region with orange on mid foot was replaced by green, indicating that the load in this region was reduced. The color that changed from red to blue represented the stress variation from large to small

