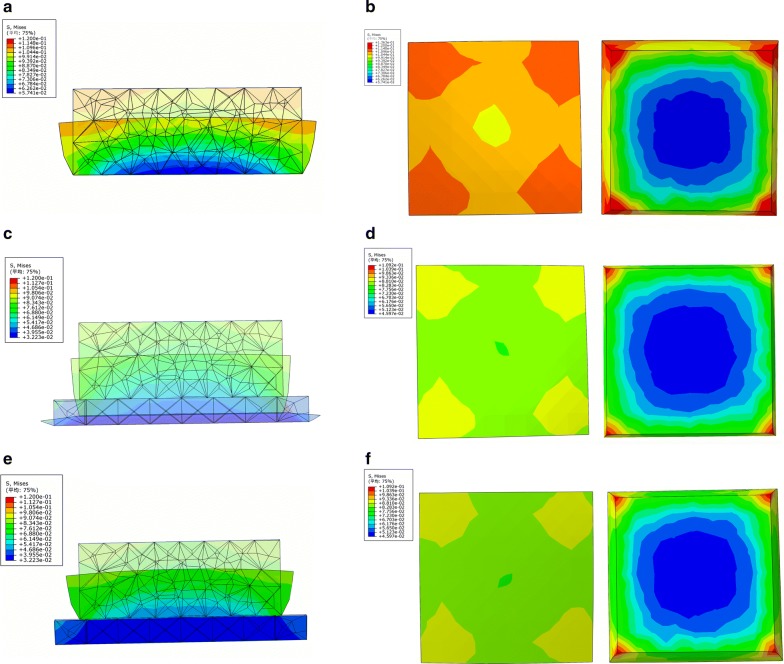
Fig. 6.
The results of the simplified FE model simulation. The three-view drawings of no-cup group (a, b), soft cup group (c, d), and hard cup group (e, f) demonstrated the deformation and stress of soft tissue and cup. The upper cube represented the soft tissue and the material parameters were same as soft tissue. The cube below represented the heel cup and the tensile modulus was set as 100 and 1800 MPa, respectively. The pattern made up of meshes represented the original shape, and the entity pattern represented the shape under compression. The color that changed from red to blue represented the stress variation from large to small

