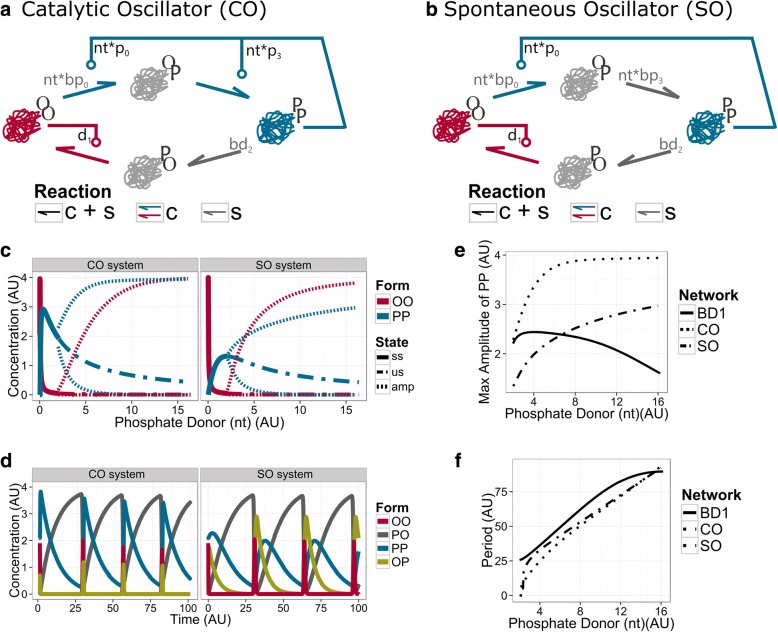
Fig. 5.
The minimal oscillatory systems: Catalytic Oscillator (CO) network and Spontaneous Oscillator (SO) networks. Wiring diagram of CO (a) and SO (b) networks. Both networks maintain the spontaneous dephosphorylation of PP into PO (grey arrow), OO has the control over the modification of PO into itself, and PP keeps its catalytic control over the transition from OO to OP. In the CO network PP also catalyses the phosphorylation of OP into PP, while in the SO network this reaction is spontaneous. c Bifurcation analysis. The graphic shows how the steady-state concentration of the catalytic molecules, OO and PP are affected by the availability of phosphate donor (nt). Stable steady states (ss) precedes the oscillatory solutions (unstable steady state (us) – dashed line, max and min of the amplitude of oscillation (amp) - striped lines). d Time course diagram. The phosphate donor is set to nt = 4 AU. e Maximal amplitude of the BD1, CO and SO networks. f Period of the BD1, CO and SO networks over a range of phosphate donor values. See networks topology in Methods for more information about the structure and Table 2 in Methods for values of parameters

