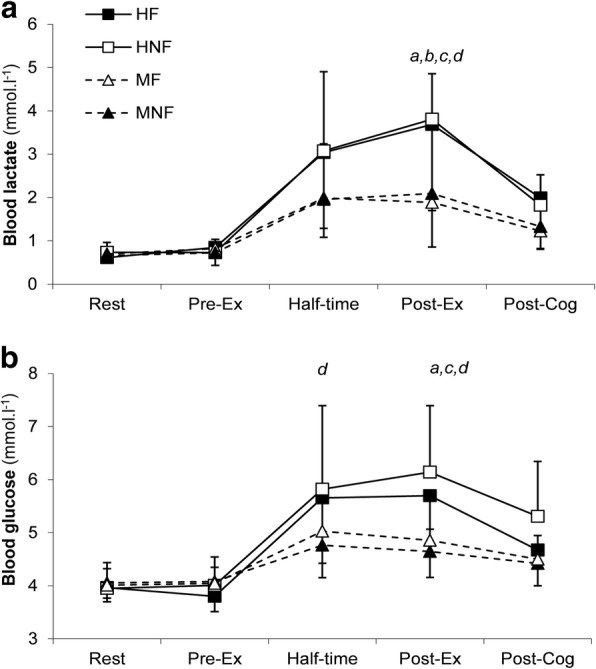
Fig. 4.

The mean (± SD) blood lactate (panel a) and glucose (panel b) concentration during the FHITP. (HF: hot environment with fluid; HNF; hot environment no fluid; MF; moderate environment with fluid; MNF: moderate environment no fluid). Lactate: Main effect condition (P = 0.040), time (P < 0.001) and condition x time interaction (P < 0.001). Glucose: Main effect condition (P = 0.025), time (P < 0.001) and condition x time interaction (P < 0.001). a = P < 0.05 between HF and MF, b = P < 0.05 between HF and MNF, c = P < 0.05 between HNF and MNF, d = P < 0.05 between HNF and MF
