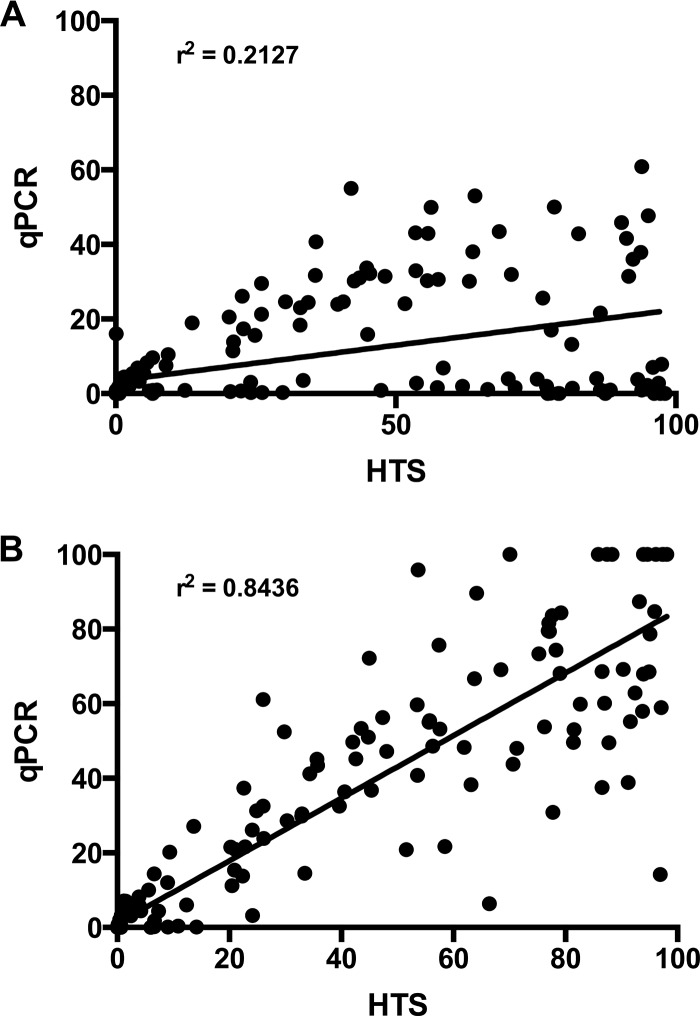
FIG 1.
Correlation of B. longum group quantitation in Chinese infants by HTS and qPCR. The plot includes multiple time points for each individual. A linear regression line is shown along with the Pearson correlation r2 value. (A) Combined relative abundances for B. longum subsp. longum and B. longum subsp. infantis obtained by tuf gene-targeted qPCR assay versus HTS B. longum sequences. (B) Combined relative abundances for B. longum subsp. longum and B. longum subsp. infantis obtained by 16S rRNA gene-targeted qPCR assay versus HTS B. longum sequences.

