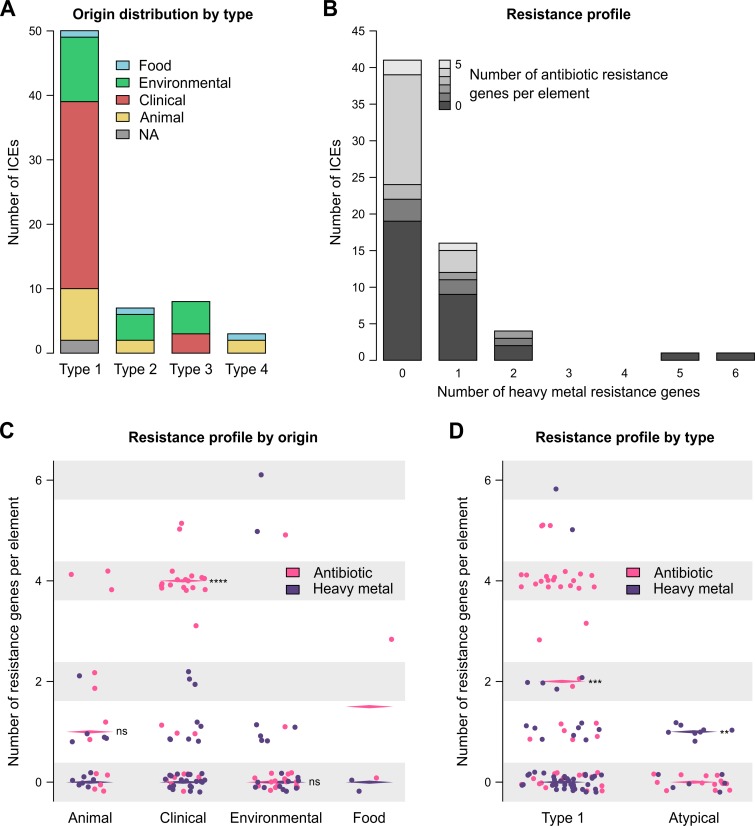
FIG 3.
Distribution of ICEs and resistances. (A) Distribution of ICE types for each isolation niche. (B) Prevalence of heavy metal and antibiotic resistance genes. (C) Resistance profiles by niche of isolation. (D) Resistance profiles according to ICE types. Statistical analyses were performed using the Wilcoxon matched-pairs signed-rank test (two-tailed) to compare the medians of each resistance type for each isolation niche (animal, P = 0.1328; clinical, P < 0.0001; environmental, P = 0.2227) and according to the type (type 1, P = 0.0002; atypical, P = 0.0078).

