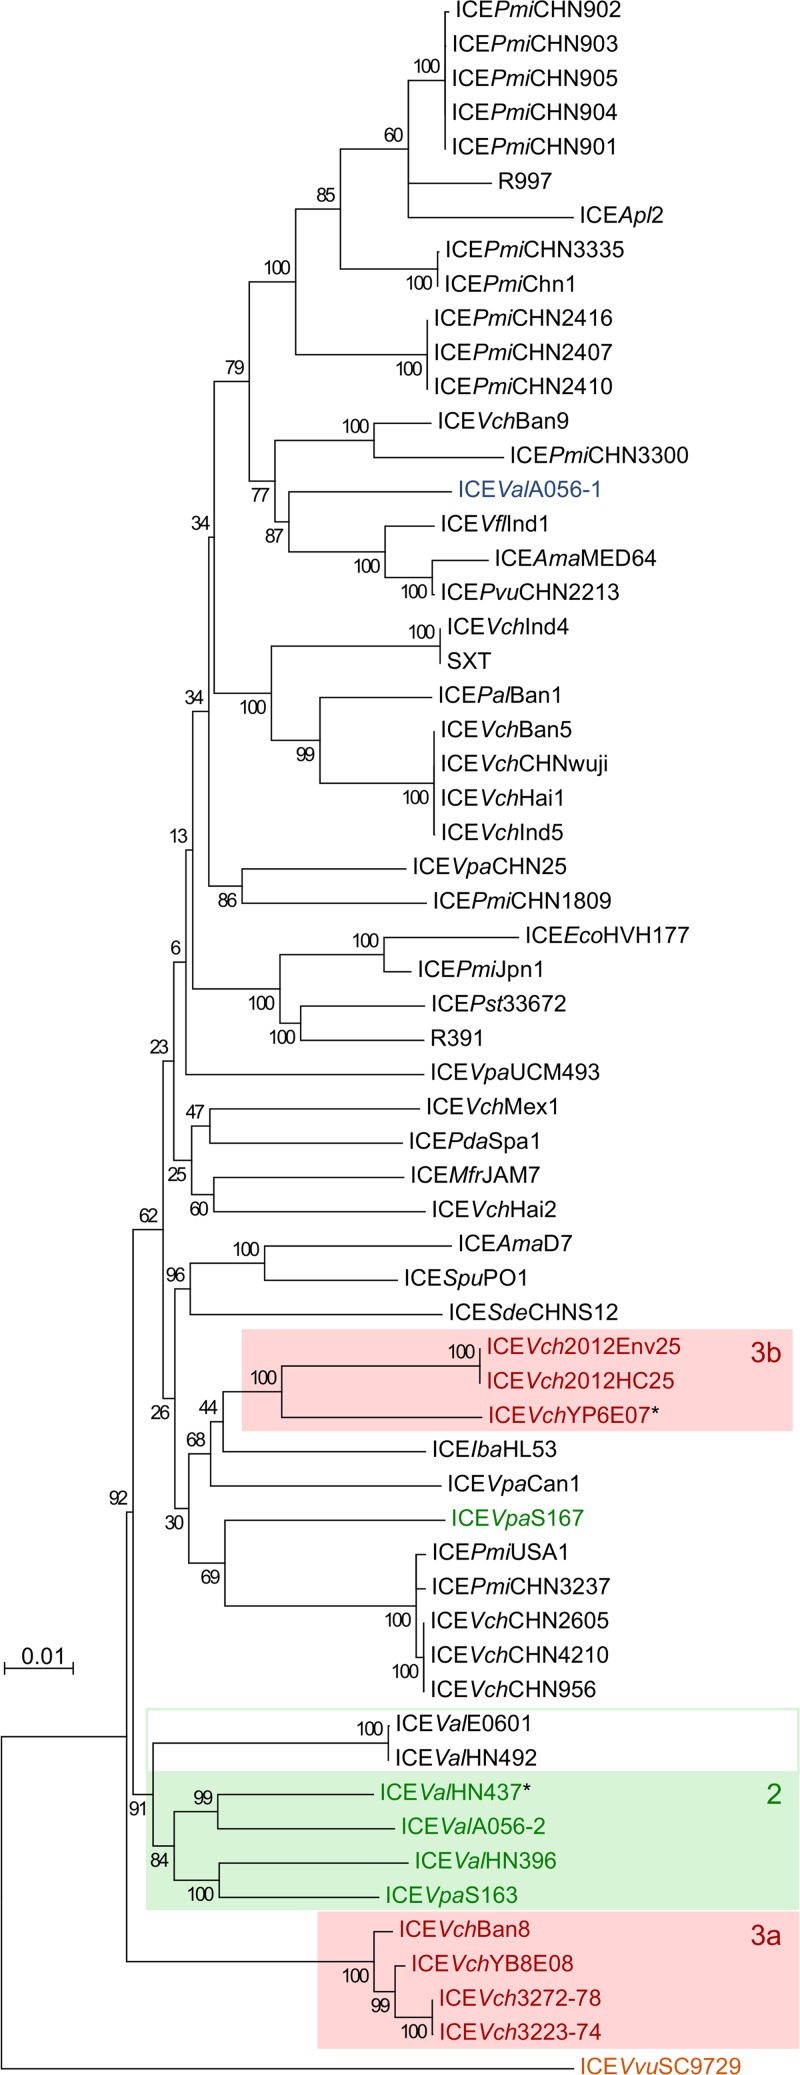
FIG 7.
Maximum likelihood phylogenetic analysis of the soft core of 61 ICEs. Branch length represents the number of substitutions per site over 24,943 nucleotide positions. All gaps were removed prior to analysis. Labels are color coded as described for Fig. 5. Asterisks indicate ICEs with an ambiguous entry exclusion group.

