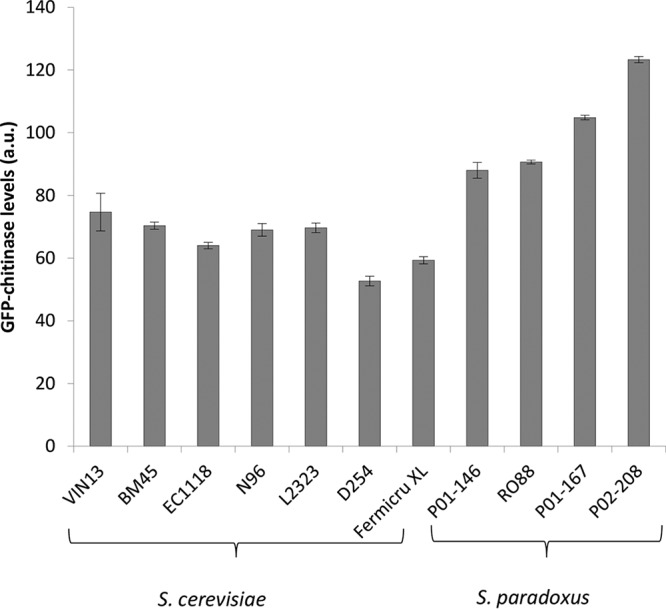
FIG 5.

GFP-chitinase levels bound to different yeast strains, quantified using a BD FACSAria flow cytometer. Fluorescence levels shown are a result of subtracting the value corresponding to the control GFP protein bound to the cell walls from the total GFP-chitinase fluorescence levels. Cells were grown in YPD, as described by de Groot et al. (43), and equal amounts of cells based on the OD measurement at 600 nm were washed and resuspended in PBS buffer before adding GFP-tagged chitinase. Cells were further incubated for 2 h at room temperature with shaking before washing and resuspending in PBS buffer in preparation for quantification using a flow cytometer. Fluorescence intensity is expressed in arbitrary units (a.u.).
