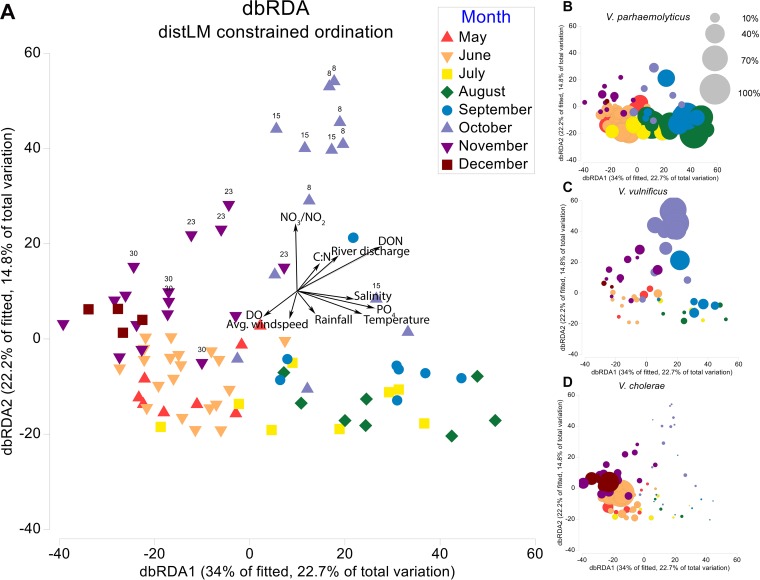
FIG 3.
(A) Distance-based redundancy analysis (dbRDA) plot of the fitted distLM model for Vibrio communities in the NRE. Each point in the ordination represents the Vibrio community in a given water sample. The distance between points is the Bray-Curtis distance (dissimilarity) between Vibrio communities. Vectors denote significant environmental gradients (P < 0.05) in the distLM. Points associated with increased river discharge after Hurricane Matthew are labeled according to the number of days post-Matthew the sample was taken. The ordination is also presented as bubble plots in which point size is proportional to the relative abundances of V. parahaemolyticus (B), V. vulnificus (C), and V. cholerae (D). The bubble key indicates bubble size for 100, 70, 40, and 10% of the range for each species.

