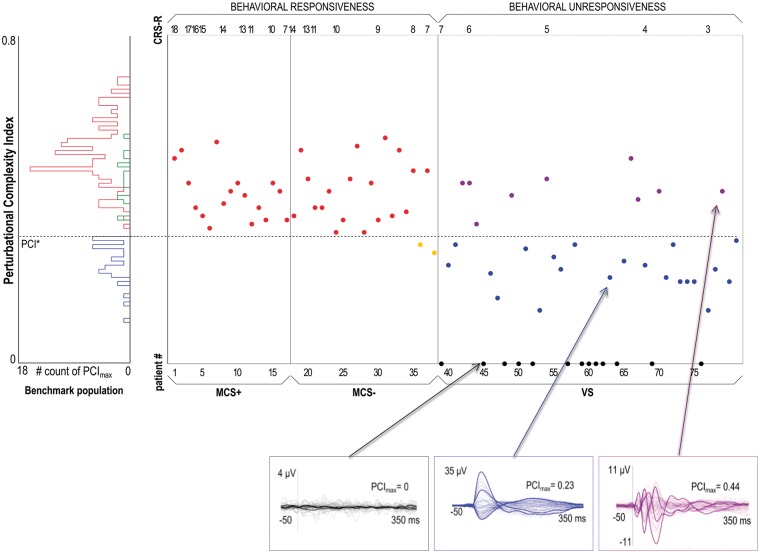
Figure 4.
PCI* performance tested on behaviorally responsive and unresponsive patients. The histogram on the left summarizes the distribution of PCI in the benchmark population, specifically obtained in the absence of subjective report (blue) and in the presence of subjective report (delayed, green; immediate, red) conditions. The dashed horizontal line highlights the optimal cutoff (PCI*) computed from ROC curve analysis on the benchmark population. The scatter plot on the right shows all the PCI values obtained in minimally conscious state (MCS+/MCS−) and unresponsive patients (VS). Within each diagnostic group, patients are sorted by the CRS-R total score in decreasing order. The three boxes at the bottom show the average TMS-evoked potentials (all channels superimposed, with three illustrative channels highlighted in bold), together with the PCI values for three representative unresponsive patients (VS) with individual value of PCI respectively=0 (left, in black), lower than PCI* (center, in blue), and higher than PCI* (right, in purple) (modified from Casarotto et al. 2016).

