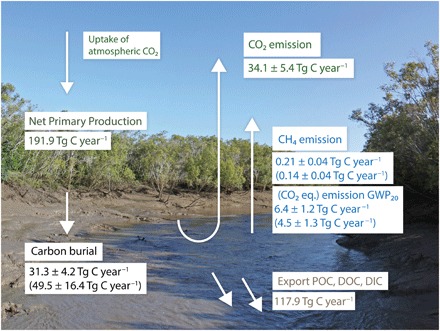
Fig. 1. Mangrove NPP versus mangrove carbon loss.

The mangrove NPP of 191.9 Tg C year−1 and tidal exports of POC (25.6 Tg C year−1), DOC (13.7 Tg C year−1), and DIC (78.6 Tg C year−1) are derived from Alongi and Mukhopadhyay (13) and scaled to the total global mangrove area estimate of Giri et al. (25). Global mangrove CO2 emissions of 34.1 ± 5.4 Tg C year−1 are from Rosentreter et al. (14). Global mangrove CH4 emissions are further presented as CO2 equivalent emissions using the GWP20 (Table 2). The values presented in brackets are the latitudinal scaled total CH4 emission and burial rates (Table 3). Photo used with permission from A. McMahon.
