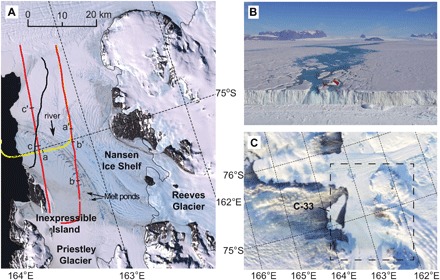
Fig. 2. Nansen Ice Shelf surface river and calving event.

(A) Landsat image of the Nansen Ice Shelf region from 2 January 2014 overlain with aerogeophysical coverage from October 2011 (yellow) and December 2014 (red). The lowercase letters indicate the plotted extents of radar and altimetry data shown in Fig. 3 (B to D). The thick solid black line is the 2016 calving front, and the thin black line is the grounding line. (B) Nansen River on 13 January 2014 flowing into a transverse surface fracture. (C) MODIS image from 7 April 2016 showing the calving of two icebergs from the Nansen Ice Shelf along the fracture shown in (B). The dashed box indicates the spatial extent of (A).
