
Fig. 2. Chloride concentration and stable isotopic compositions of pore water in sediments of KMV#5.
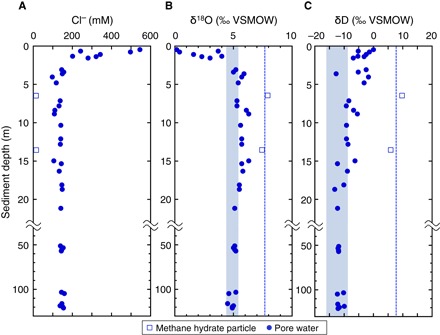
Vertical profile of Cl− (A), δ18O (B), and δD (C) of pore water in sediments. Circle and square plots represent pore water sample and water from dissociated gas hydrate fragment, respectively. Dashed line represents the averaged isotopic value of methane hydrates, and blue-filled range denotes original δ18O and δD values of pore water before the formation of methane hydrates.