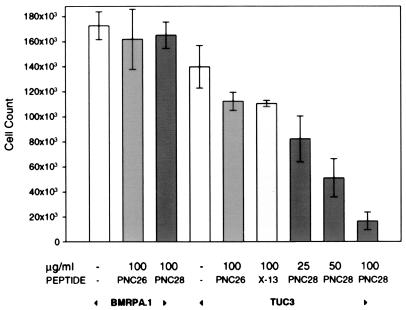
Figure 3.
Effects of different peptides on the growth of BMRPA1 and TUC-3 cells. Experiments with each of these cell lines are indicated by the arrowheads at the bottom of the figure. The specific peptides and, above them, their concentrations (μg/ml), are given along the abscissa. The number of viable cells (ordinate) was determined by using the trypan blue exclusion method.

