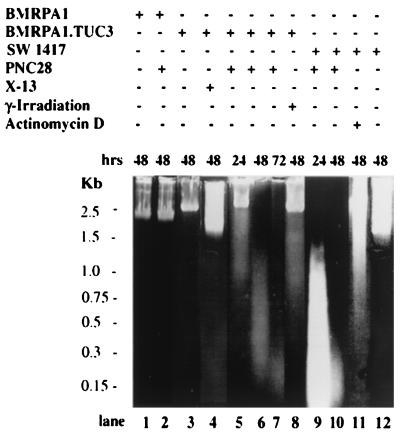
Figure 5.
Propidium iodide staining of total cell DNA revealing the fragmentation patterns for different cell lines [BMRPA1, BMRPA1.TUC-3 (TUC-3), and SW1417] subjected to different conditions (i.e., PNC-28, actinomycin D, or irradiation). Cell line and treatment agent are given above each lane of the gels; lane numbers (“lane”) are given at the bottom of the figure; the time of treatment is given immediately above each lane; and molecular weight markers are given to the left of the gel.

