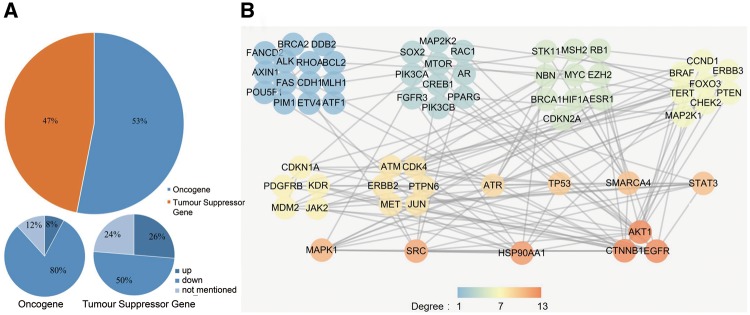
Figure 4.
(A) The cancer-related genes that were classified as oncogenes and TSGs. (B) The PPI network of the collected cancer genes. All genes were sorted by their degree in the network, and all genes with the same degree were clustered together. The degree represents the prominence of the node, which is equal to the number of edges connected to it. The node colour means each gene’s degree.

