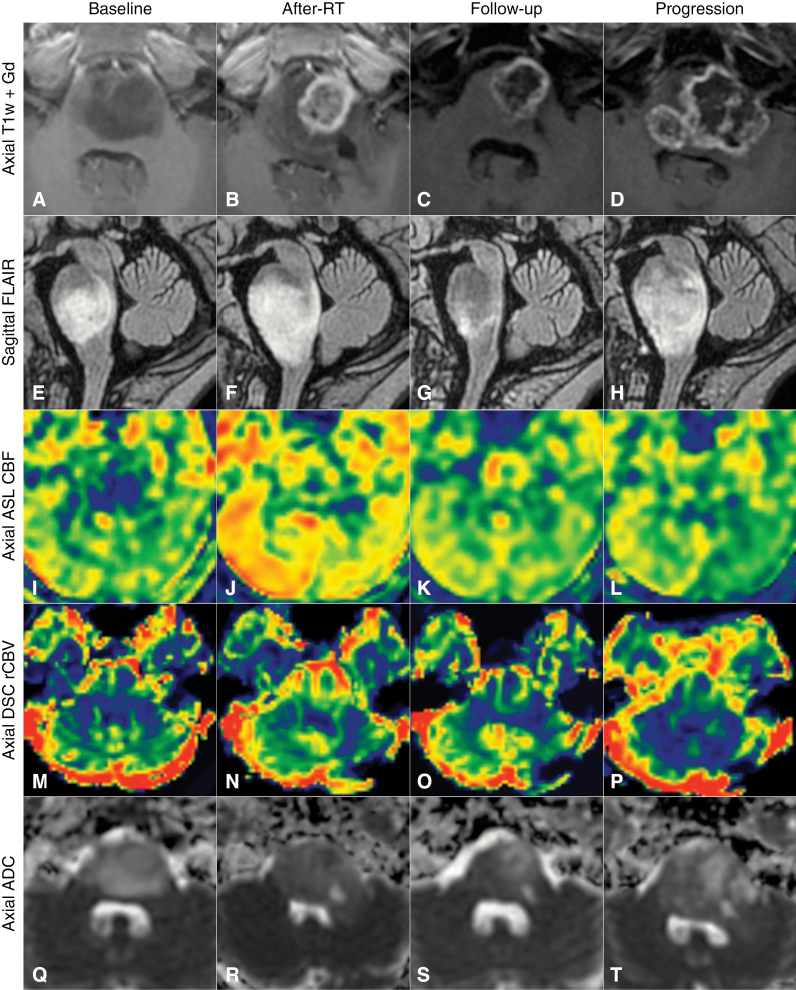
Fig. 2.
Longitudinal follow-up of an example case of pseudoprogression with 4 timepoints: at baseline, the week following the end of RT (after RT), at a follow-up examination 3 months after the end of RT, and finally at true progression 9 months after RT. (A–D) Axial T1-weighted images after contrast injection. (E–H) Sagittal T2 FLAIR images, (I–L) axial ASL-CBF, M-P, axial DSCrCBV, Q-T, axial ADC. Note the increase in contrast enhancement and volume of T2 FLAIR abnormalities after RT, associated with increased blood flow and decreased apparent diffusion. These changes reverted spontaneously by a follow-up examination 3 months later.

