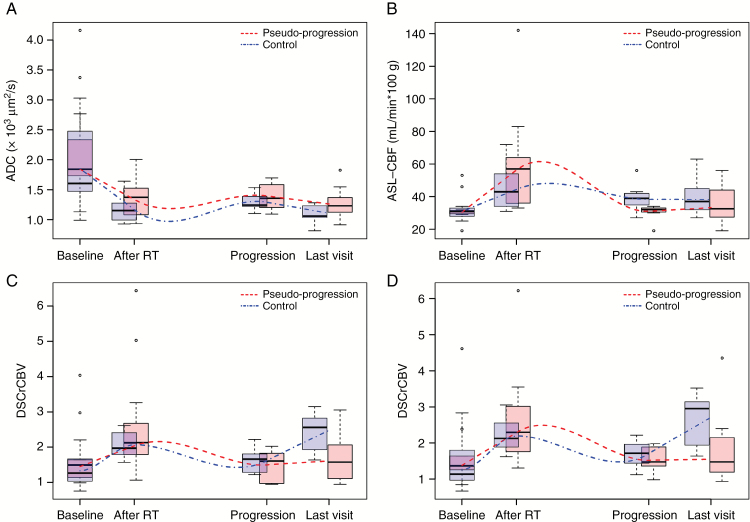
Fig. 3.
Boxplot with whiskers representing the distribution of (A) ADC, (B) ASL-CBF, (C) DSCrCBV, and (D) DSCrCBF median values at baseline, after RT, during true progression, and at the last visit for all patients that showed pseudoprogression (in red) and those in the control group (in blue). Lines representing the underlying trend for each group were calculated by local nonparametric regression. Units: ADC in 103 µm2/s, ASL-CBF in mL/min per 100 g tissue.

