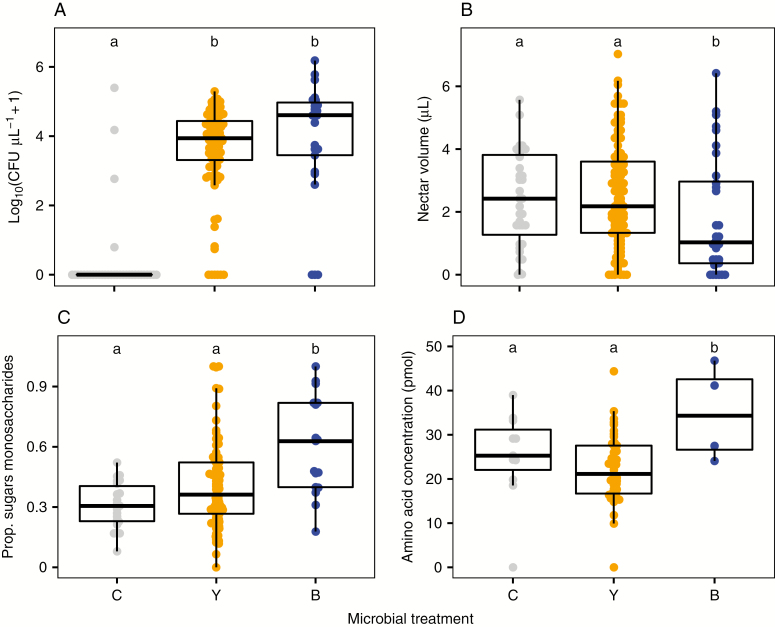
Fig. 1.
Effects of microbial inoculation treatment on nectar characteristics 3 d after inoculation with yeast (Y), bacteria (B) or a sucrose control (C). Measured characteristics included (A) log10 (microbial CFUs + 1) in nectar assessed on YM or R2A plates; (B) total nectar volume (µL) per flower; (C) the proportion of monosaccharides in nectar (fructose + glucose)/(fructose + glucose + sucrose); and (D) the total amino acid concentration measured in nectar (pmol). The midline in the box represents the median, and edges represent Q1 and Q3. Letters in each panel represent treatments that differed (P < 0.05 based on a Tukey HSD test).

