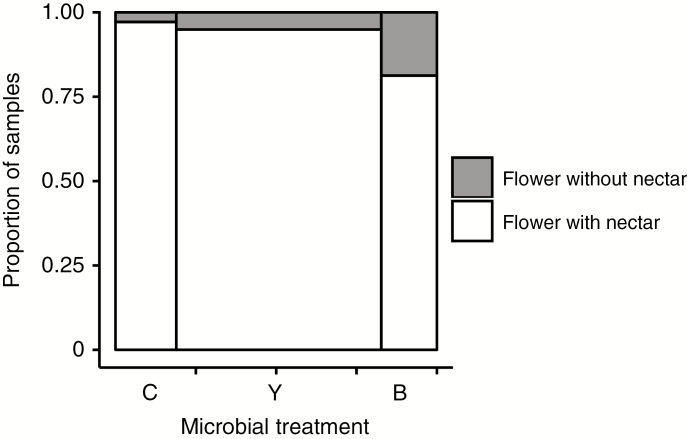
Fig. 2.
Mosaic plot indicating the frequency of measurable nectar (yes >0 µL of nectar per flower) in flowers that were inoculated with sucrose control (C), yeast (Y) or bacteria (B) 3 d previously. Flowers without nectar were also wilted and browned. n = 185 recovered flowers (some were lost due to wind or florivory). Treatments differed at P = 0.015. Bar width indicates the relative number of replicates within each treatment group.

