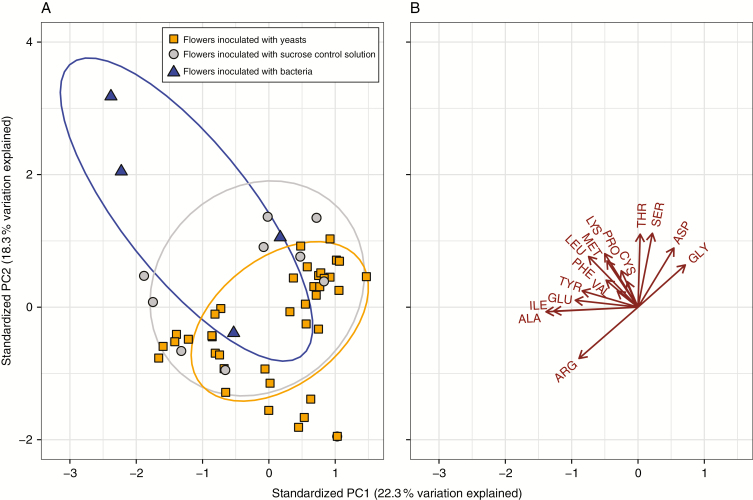
Fig. 3.
Effect of microbial inoculation on the composition of amino acids in nectar. (A) Ovals indicate the 95 % confidence interval for taxonomic groups (yeasts, bacteria, or sucrose control). MANOVA treatment P < 0.0001. (B) Letters indicate amino acid vectors, with arrows pointing towards samples with a higher abundance of amino acids.

