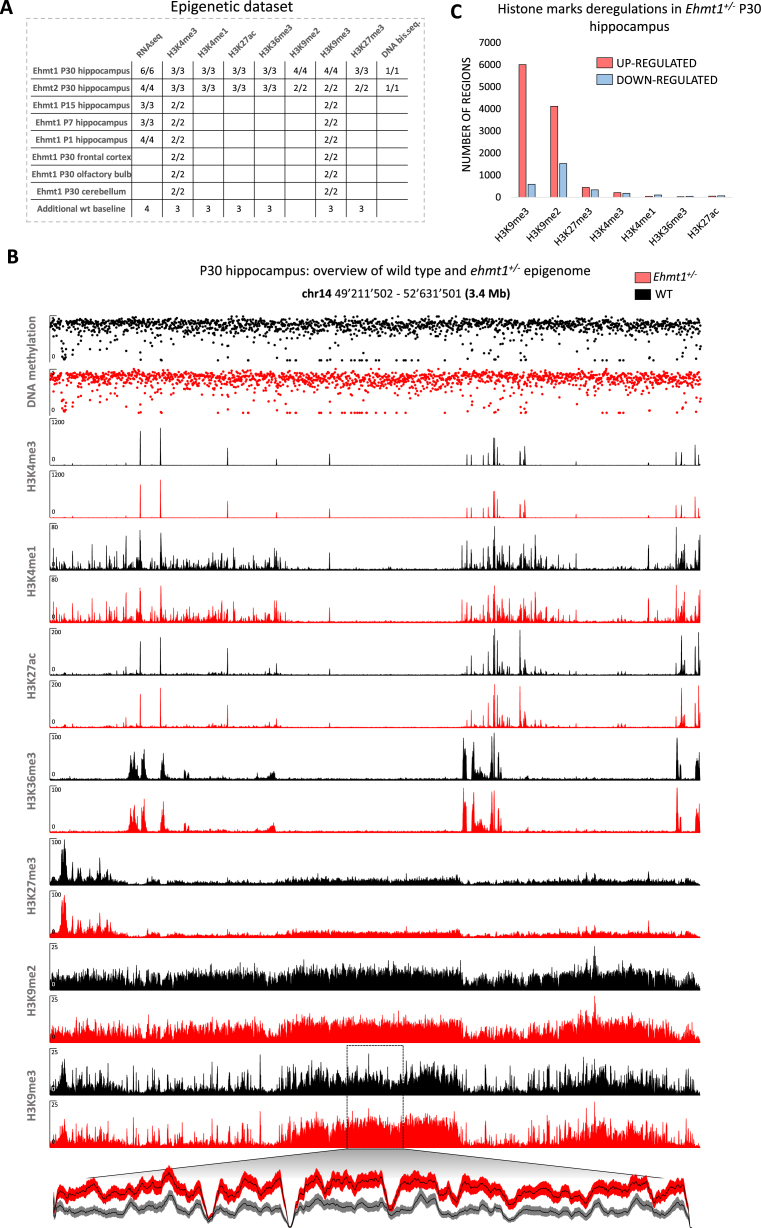
Figure 1.
Overview of the epigenetic dataset. (A) Samples table indicating the number of mice used in each experiment (wild type/mutant). (B) Examples of tracks. Y-axis: coverage is shown for ChIP-seq tracks. Methylation (0–1) is shown for DNAme track. Magnified plot for a region with increased H3K9me3 is shown (mean ± SEM). (C) Overview of genome-wide deregulations for histone marks. H3K4me3, H3K27ac, H3K36me3 and H3K4me1 peaks were called and DEseq2 was used to detect significant deregulations (P< 0.01) in Ehmt1+/− animals as compared to wild type littermates. For the repressive marks, generally distributed in extended stretches, a genome-wide sliding window analysis and DEseq2 were used to detect significant deregulations (P< 0.001, see methods).

