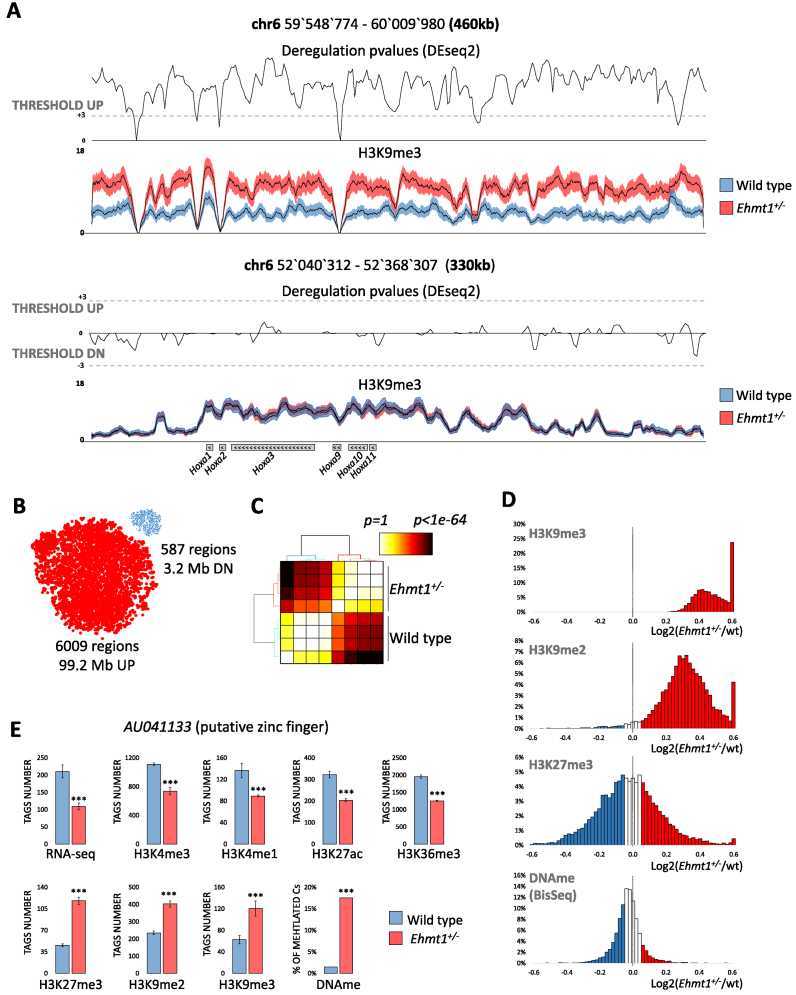
Figure 2.
Epigenetic profiling of Ehmt1+/− unveils extensive up-regulation of H3K9me3. (A) Examples of regions showing a significant increase of intergenic H3K9me3 or unaltered H3K9me3 over Hoxa genes. Average H3K9me3 coverage ± SEM, P-values (DEseq2, see methods) and threshold for up/down-regulations (P< 0.001 equal to Z-score = 3). ( B) Predominant H3K9me3 up-regulation in Ehmt1+/− as show by the dimensionally reduced (t-sne) plots of deregulated regions where dot size is proportional to the average length (17 kb up, 5kb down). The clear segregation into two clouds indicates reproducibility of deregulations. (C) Clustering of statistical likelihood in H3K9me3 up-regulated regions segregates Ehmt1+/− and wild type samples (Kruskal–Wallis test, euclidean distance, hierarchical clustering with Ward's linkage). (D) Distribution of repressive epigenetic marks in the 6009 regions with increased H3K9me3. While H3K9me3 and H3K9me2 are strongly shifted towards positive values, indicating up-regulation, H3K27me3 and DNA methylation are centered on zero, indicating lack of correlation with H3K9me2/3. ( E) AU041133, the gene with the strongest epigenetic repression in Ehmt1+/−. Promoter (H3K4me1/3/K27ac/me3/K9me3), gene body (H3K36me3/K9me2), CpG island (DNAme). DEseq2 P-values *P< 0.05, **P< 0.025, ***P< 0.01 (see Materials and Methods) Y-axis, normalized tags, mean ± SEM.

