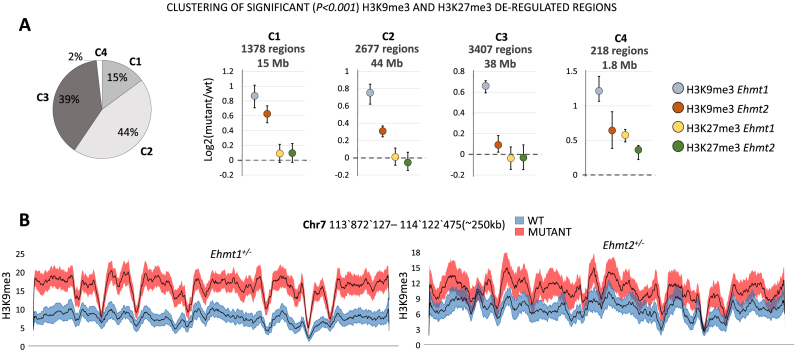
Figure 3.
Ehmt1+/− and Ehmt2+/− comparative analysis of repressive histone marks. (A) Clustering of the regions with significant (P< 0.001) H3K9me3 or H3K27me3 deregulations in Ehmt1+/− or Ehmt2+/− samples. Left: Pie chart size representing the size of each cluster in terms of base pairs covered, genome-wide. Right: Centroids mean, 25th and 75th percentiles for clusters C1–4. For each cluster the total amount of regions and their total length (size in base pairs) is indicated. Only in 15% of regions (C1) Ehmt2+/− displays an increase of H3K9me3 comparable to Ehmt1+/−. Changes in H3K27me3 are negligible (C4, 2%). (B) Example of H3K9me3 tracks. Average +/- SEM of a region formed by elements of C1 and C2 and encompassing several olfactory receptors (from Olfr697 to Olfr711, not shown).

