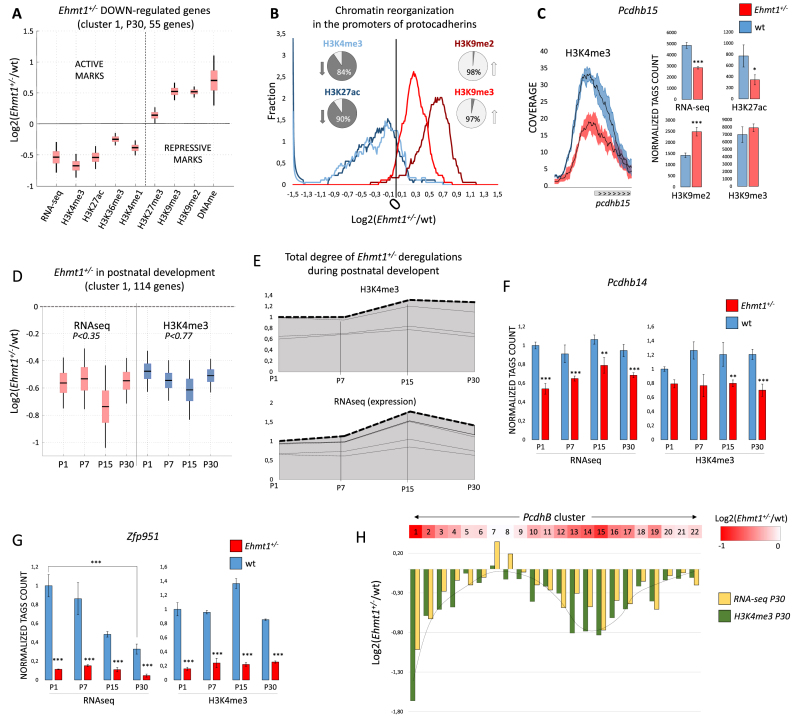
Figure 4.
Epigenetic profiling of Ehmt1+/− developmental and adult hippocampus. (A) Increase of H3K9 methylation and repression of expression. Boxplot, mean ± SEM and 99% confidence interval for the genes of down-regulated cluster 1. Other deregulated genes are shown in Supplementary Figure S4B. (B) Epigenetic repression of protocadherins in Ehmt1+/− hippocampus. Smoothed bin count, percentages represent number of promoters <0 (down) or >0 (up). (C) Pcdhs beta subfamily is the most affected (9/21, 42% are repressed), example of Pcdhb15 (mean ± SEM, *P< 0.05, **P< 0.025, ***P< 0.01). (D) Analysis of postnatal development: 255 were found deregulated (P< 0.01). The genes were divided in 5 clusters according to the profile (see methods). The biggest cluster, C1, is shown, mean+/-SEM, 99% confidence interval (additional clusters in Supplementary Figure S5C-F). For C1, Kruskal-Wallis test rejects the hypothesis of different means, both in RNA-seq and H3k4me3, indicating stability of repression from P1 to P30. (E) Deregulated Ehmt1+/− epigenomes are largely stable during development, implying that deregulations are established during embryogenesis. Stacked centroids of the five clusters (C1–C5) transformed in each weighted for its size. (F–G) Examples of Ehmt1+/− deregulated genes in development. Y-axis, number of tags, normalized to P1, mean ± SEM. DEseq2 P-values (*P< 0.05, **P< 0.025, ***P< 0.01). (H) Overview of Pcdhs beta cluster, from Pcdhb1 to Pcdhb22, red-colored proportionally to the average RNAseq and H3K4me3 down-regulation. Down-regulation has a clear spatial distribution, with Pcdhb1 and Pcdhb14/15 being at the center of strongest repressed loci.

