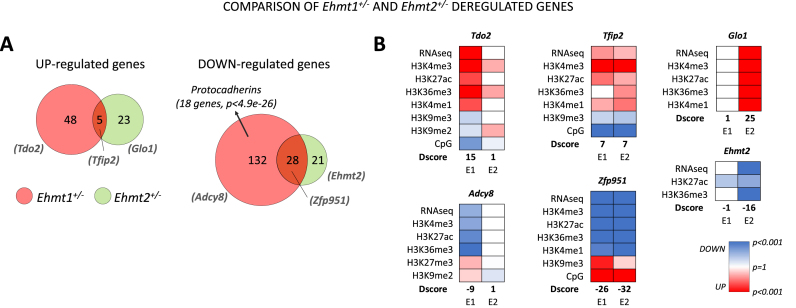
Figure 5.
Ehmt1+/− and Ehmt2+/− comparative analysis of deregulated genes. (A) Venn diagrams comparing Ehmt1+/− and Ehmt2+/− deregulated genes. Diagrams are based on D-scores which take into account expression and epigenetic makeup (see Materials and Methods). (B) Most representative examples (as ranked in Supplementary Table S1, GEO). Only deregulated marks are shown and D-scores of each gene is indicated for each mutant model (E1 = Ehmt1+/−, E2 = Ehmt1+/-).

