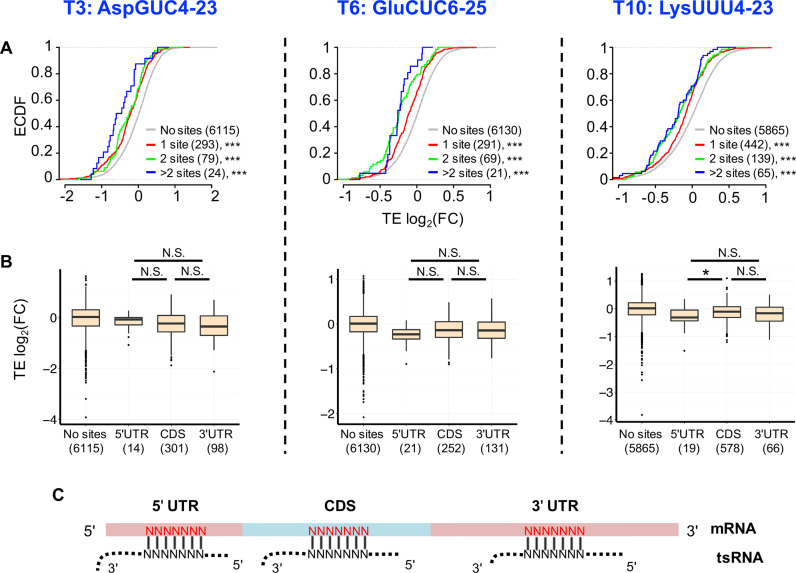
Figure 3.
tsRNAs repress translation of target mRNAs via antisense pairing. (A) Cumulative distribution of changes in translational efficiency (TE) for all the genes. The x-axis is the log2(FCTE) in S2 cells transfected with the tsRNA mimic (T3, T6, T10 from left to right) versus transfection with ss-NC. The genes with 7-mer sites conserved between Drosophila melanogaster and Drosophila virilis and antisense paired to any part of a tsRNA are defined as tsRNA target genes. Red: genes with one conserved tsRNA target site, Green: genes with two conserved tsRNA target sites, Blue: genes with more than two conserved tsRNA target sites, Gray: genes without any target site of the transfected tsRNA in the entire mRNA. The number of genes in each category is indicated in parentheses. The asterisks indicate a significant difference in TE FC compared with the ss-NC control group. ***P < 0.001. (B) Repression efficiency of tsRNA is independent of the location of the tsRNA target sites in a mRNA transcript. The y-axis is the log2(FCTE) (comparing T3, T6 and T10 transfections with ss-NC from left to right). The x-axis is the location of the tsRNA mimic target sites in a mRNA transcript. ‘No sites’: mRNAs without conserved target sites for that tsRNA; ‘5′UTR’: mRNAs with conserved target sites in the 5′ UTRs, ‘CDS’: mRNAs with conserved target sites in CDSes, ‘3′UTR’: mRNAs with conserved target sites in the 3′ UTRs. The number of genes in each category is given in the parentheses. *P < 0.05; N.S. not statistically significant. (C) A scheme showing a tsRNA antisense pairing to evolutionarily conserved 7-mer target sites (in red) in different locations of a mRNA.

